The data was always there.
We just made it sing.
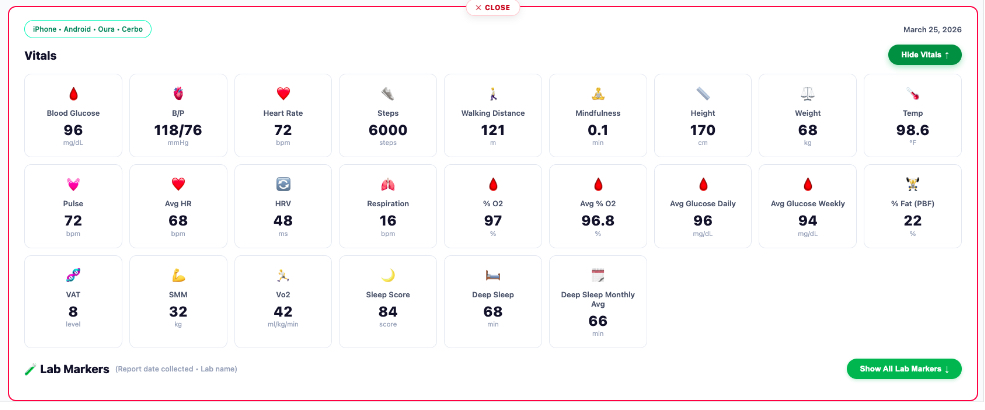
Introducing Patient Portal Health Insight — the new flagship from FxMedSupport that turns the rich patient history already living in Cerbo into a longitudinal visual story of every patient’s health journey. Vitals. Lab markers. Medications. Supplements. Protocols. Wearable data. All of it, graphed over time, interactive, and ready to tell the story you’ve been waiting to show.
Imagine sitting across from your patient.
In person, or on video, you pull up their entire health journey on screen. Real-time. Click-driven. Fully interactive. You select which lab markers to compare. You toggle which interventions to overlay. Together, you watch the visual story take shape.
And then you point at the screen, look your patient in the eye, and say —
Look. This is when we started this protocol. Look what happened.
That’s not a chart review.
That’s a transformation moment.
Three years of data. One visual story.
Pull any combination of lab markers, vitals, and biomarkers onto one chart. Layer in every medication, supplement, intervention, and lifestyle protocol as a colored overlay band. The patient’s entire journey, on a single screen, with every cause-and-effect relationship visible at a glance.
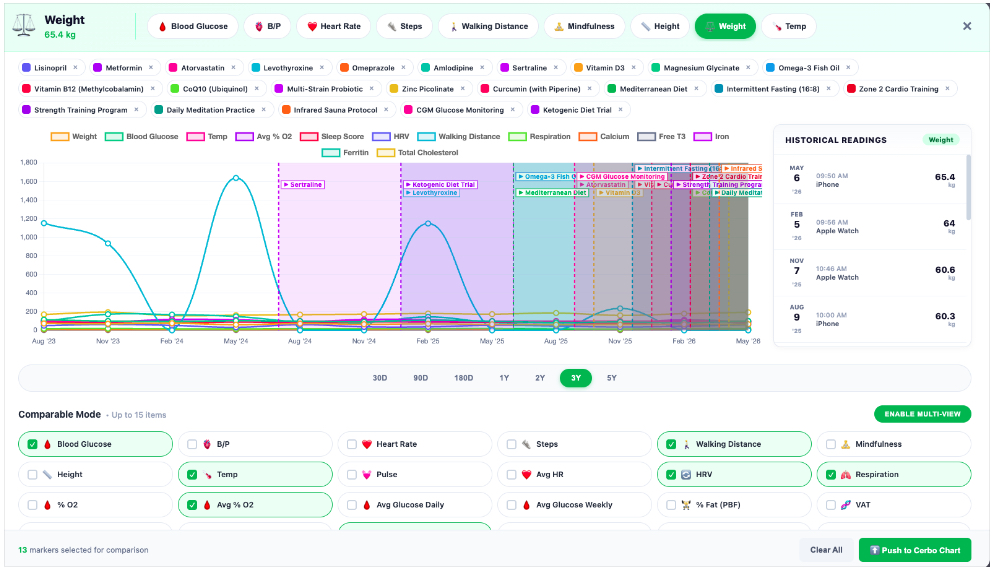
Up to 15 markers, side by side
Stack weight against blood glucose against HRV. Add walking distance and sleep score. Toggle anything in or out with a click. The patient watches the data take shape with you.
Every protocol, visualized
Started Sertraline? See the band. Began the Ketogenic Diet Trial? It overlays. Added Omega-3 Fish Oil, Mediterranean Diet, or Strength Training? All shown — color-coded across the timeline.
From 30 days to 5 years
Switch the view from 30D to 90D to 1Y to 5Y with a single click. Zoom in to investigate a recent change, zoom out to show the long arc of progress. The story is in the timeframe.
The complete care picture, automatically.
Health Insight automatically aggregates every medication, every supplement, and every alternate plan from the patient’s Cerbo record into one organized treatment panel. Each one becomes an overlay you can toggle — instantly visible against any biomarker, any vital, any trend.
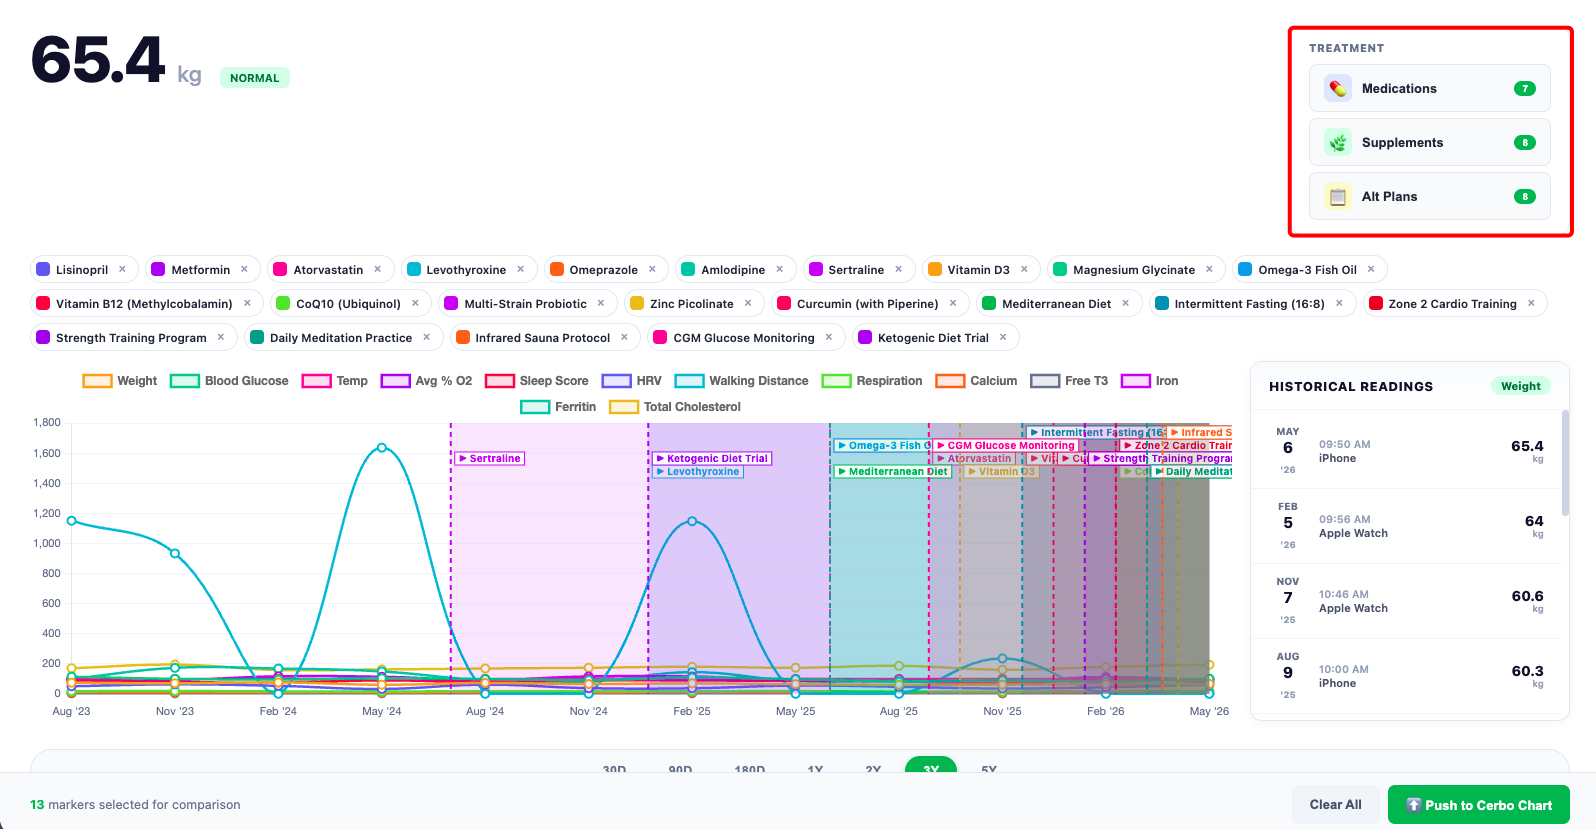
Lisinopril. Metformin. Atorvastatin. Levothyroxine. Vitamin D3. Magnesium Glycinate. Omega-3. Mediterranean Diet. Intermittent Fasting. Every protocol becomes part of the story.
One click locks the moment into the chart forever.
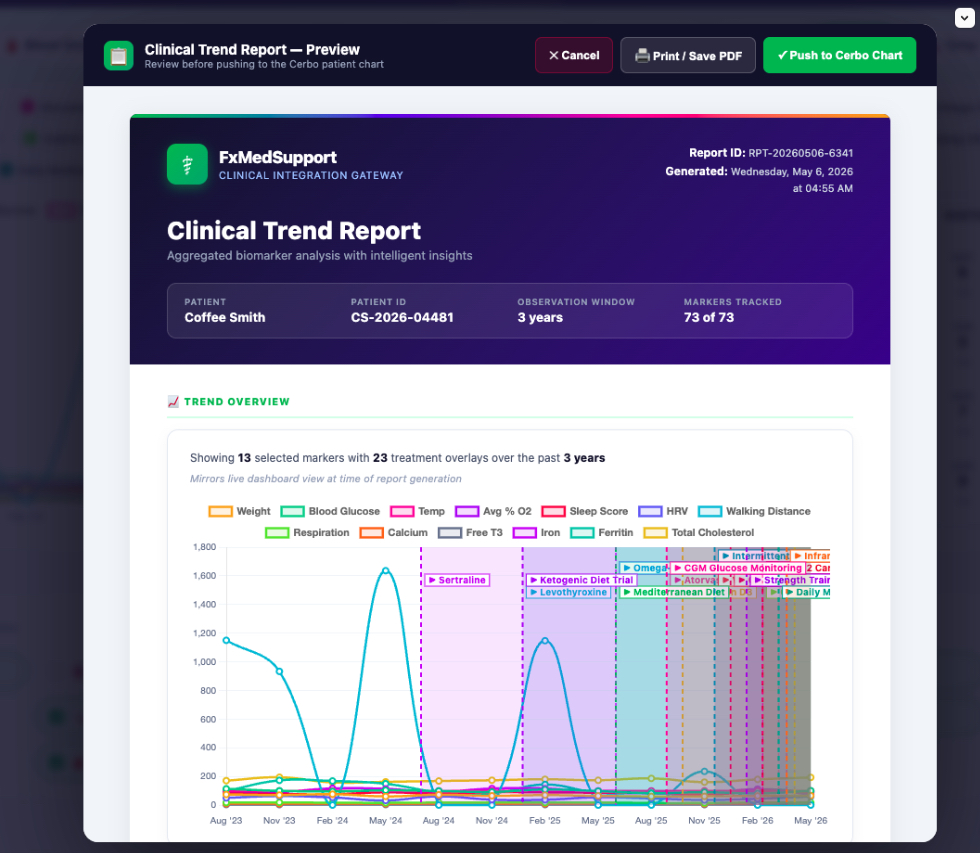
When you’ve found the story worth telling, one button creates a beautiful PDF Patient Journey Report — complete with an editable executive summary built directly from the lab markers in Cerbo.
Edit it. Refine it. Rewrite it entirely. Then one more click locks it into the patient’s chart in Cerbo, forever.
-
Build the visual story together
Patient and provider co-select markers, toggle interventions, and watch the picture form in real time.
-
Generate the Clinical Trend Report
One click produces a fully-branded FxMedSupport PDF with Patient ID, observation window, marker count, and the trend visualization embedded.
-
Refine the executive summary
The summary is built automatically from the data, then handed to you to edit, refine, or rewrite. Your clinical voice, your clinical decision.
-
Push to Cerbo Chart
One more click locks the report into the patient’s chart in Cerbo. Reviewable. Searchable. Permanent. Part of the medical record.
Everywhere your patient lives — unified.
Patient Portal Health Insight pulls from the platforms your patients actually use, plus the EHR you already trust. One view. Four data streams. Zero manual aggregation.
Cerbo holds the clinical truth. Wearables hold the daily reality.
Health Insight holds them in one screen.
Every lab marker from Cerbo. Every step, sleep cycle, and HRV reading from the patient’s wearable. Every supplement, medication, and protocol overlaid as a colored band. The complete picture — finally on one canvas, telling one story.
The data was always there.
Cerbo captured it perfectly.
We just made it sing.
Every Cerbo practice has years of beautifully captured patient data sitting in their system. Vitals. Labs. Medications. Supplements. Interventions. All of it. Right there. Meticulously recorded.
For years, that data has lived in tables, fields, and clinical notes — accurate, complete, ready. The data has always been there. What’s been missing isn’t capture. It’s been narrative. The connective tissue between a number on a lab report and the protocol that moved it. Between a supplement that started in March and the vitamin level that lifted by July.
Patient Portal Health Insight isn’t a new data system. It’s a new way for existing data to speak. Cerbo continues to be exactly what it has always been — the most precise, comprehensive EHR in functional medicine. We just gave the rich history already living inside it a new visual voice — one your patients can see, understand, and feel.
Because when a patient watches their own glucose curve flatten as a lifestyle protocol takes hold — when they see their HRV climb the month they started a new supplement — when they witness the visible arc of their own progress over three years on a single screen — something happens that no lab report alone can produce.
They believe.
This is no longer about waiting to look at a number.
This is about showing your patient who they are, where they’ve been, and where they’re going.
Show your patient who they are,
where they’ve been,
and where they’re going.
Patient Portal Health Insight is live — and ready to transform how your practice tells the story of every patient’s journey. Activate it today and see what years of perfectly captured Cerbo data look like when they finally have a voice.