Stop guessing.
Start seeing.
Introducing the Portal Cerbo Visual Reporting System — a fully visual, interactive dashboard built directly on top of Cerbo’s powerful reporting engine. One unified view of revenue, patients, providers, appointments, inventory, and clinical metrics. Then schedule beautiful PDF reports to land in the right inboxes, automatically — so every team in your practice operates from the same picture.
You’re flying with limited visibility.
Right now, you’re making decisions about your practice without seeing the full picture. You’re guessing at utilization. Estimating revenue patterns. Wondering which services actually move the needle. Hoping your team is aligned on what’s working.
You’re not flying with bad intent. You’re flying with limited visibility.
Cerbo’s reporting engine has always been incredible. Powerful, accurate, comprehensive. We just gave that data a new dimension.
This is no longer about hoping your practice is performing.
This is the visibility.
Every angle of your practice. One unified view.
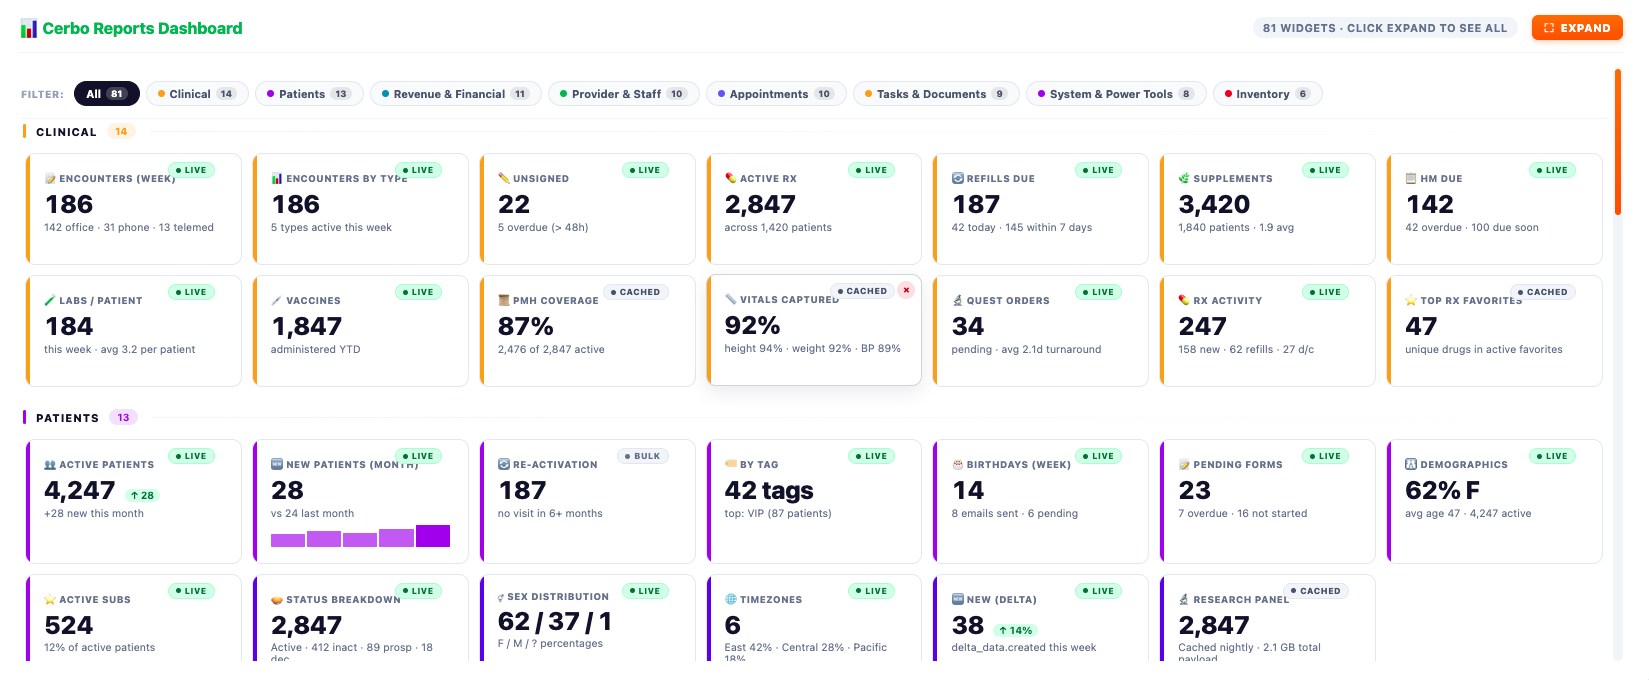
The Portal Cerbo Visual Reporting System brings every dimension of your practice into a single, beautifully designed dashboard — organized into the eight categories that match how your team already works.
Encounters, vitals, labs, supplements, vaccines, RX activity, PMH coverage — your provider team’s clinical pulse, instantly visible.
Active panel, new patients, re-activation, demographics, status, by tag — who you serve, how they’re growing, where they need attention.
Practice revenue, per-patient, per-service, top items, charges, transactions — where the money flows, in real time.
Utilization, hours available, encounters per provider, top performers, panels — who’s loaded, who’s available, who’s exceeding expectations.
Schedule utilization, no-shows, cancellations, top appointment types, booking rate — your operational rhythm, fully visible.
Task volume, document throughput, pending forms, key documents, sent items — the administrative engine behind every appointment.
Practice-wide health metrics, API activity, data integrity checks, sync status — under-the-hood visibility for your power users.
Stock levels, top-selling items, supplement movement, reorder triggers, vendor data — what’s flowing, what’s running low, what’s worth restocking.
Eight visual lenses. One unified picture. Every team member looking at the same data.
Every report opens up three ways.
Click any tile from the dashboard and a full report card opens with three tabs: Overview for the headline numbers and trend, History for the longitudinal pattern, and Data Source for the underlying breakdown. The story behind the number — instantly visible.
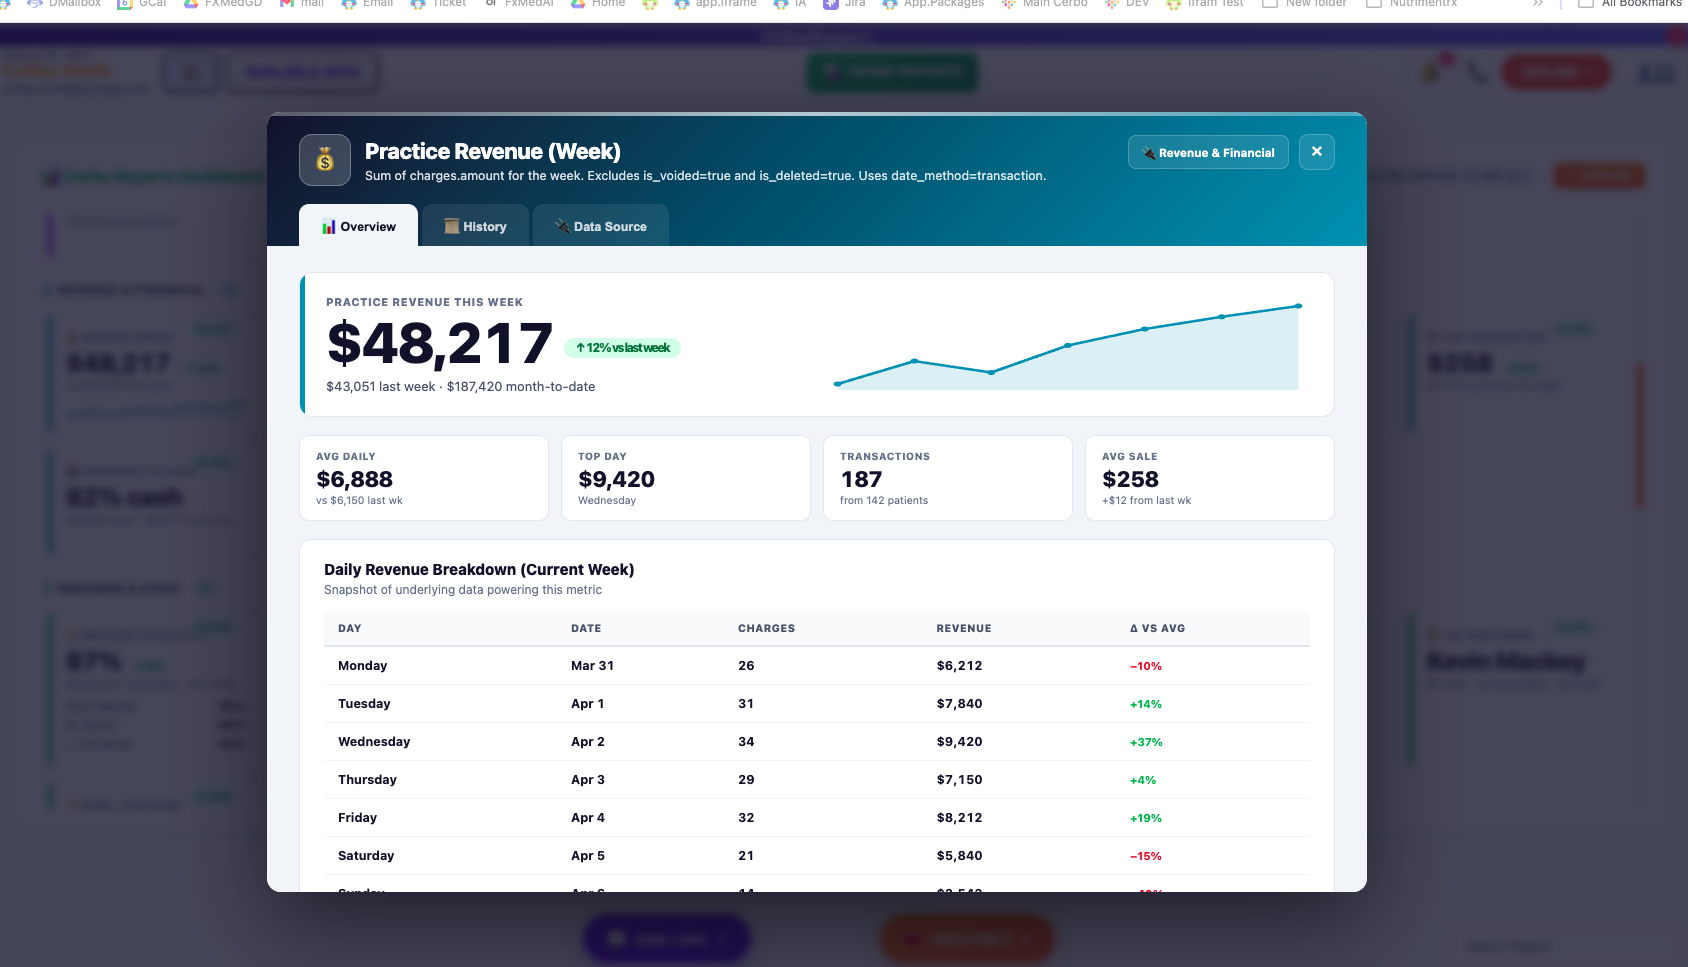
The headline story
Big number front and center. Trend arrow vs the prior period. Inline area chart showing the shape of the pattern. Four contextual metric cards — Avg Daily, Top Day, Transactions, Avg Sale — instantly answering what’s happening, and how does it compare?
The longitudinal view
See the metric over weeks, months, quarters. Spot the patterns. Catch the trends. Watch what’s moving in the right direction — and what isn’t — without ever leaving the dashboard.
The full breakdown
Daily revenue table with color-coded variance (+19% green, −15% red) against the average. Charges per day. Patient counts. The exact rows powering the headline number — fully transparent, fully drillable.
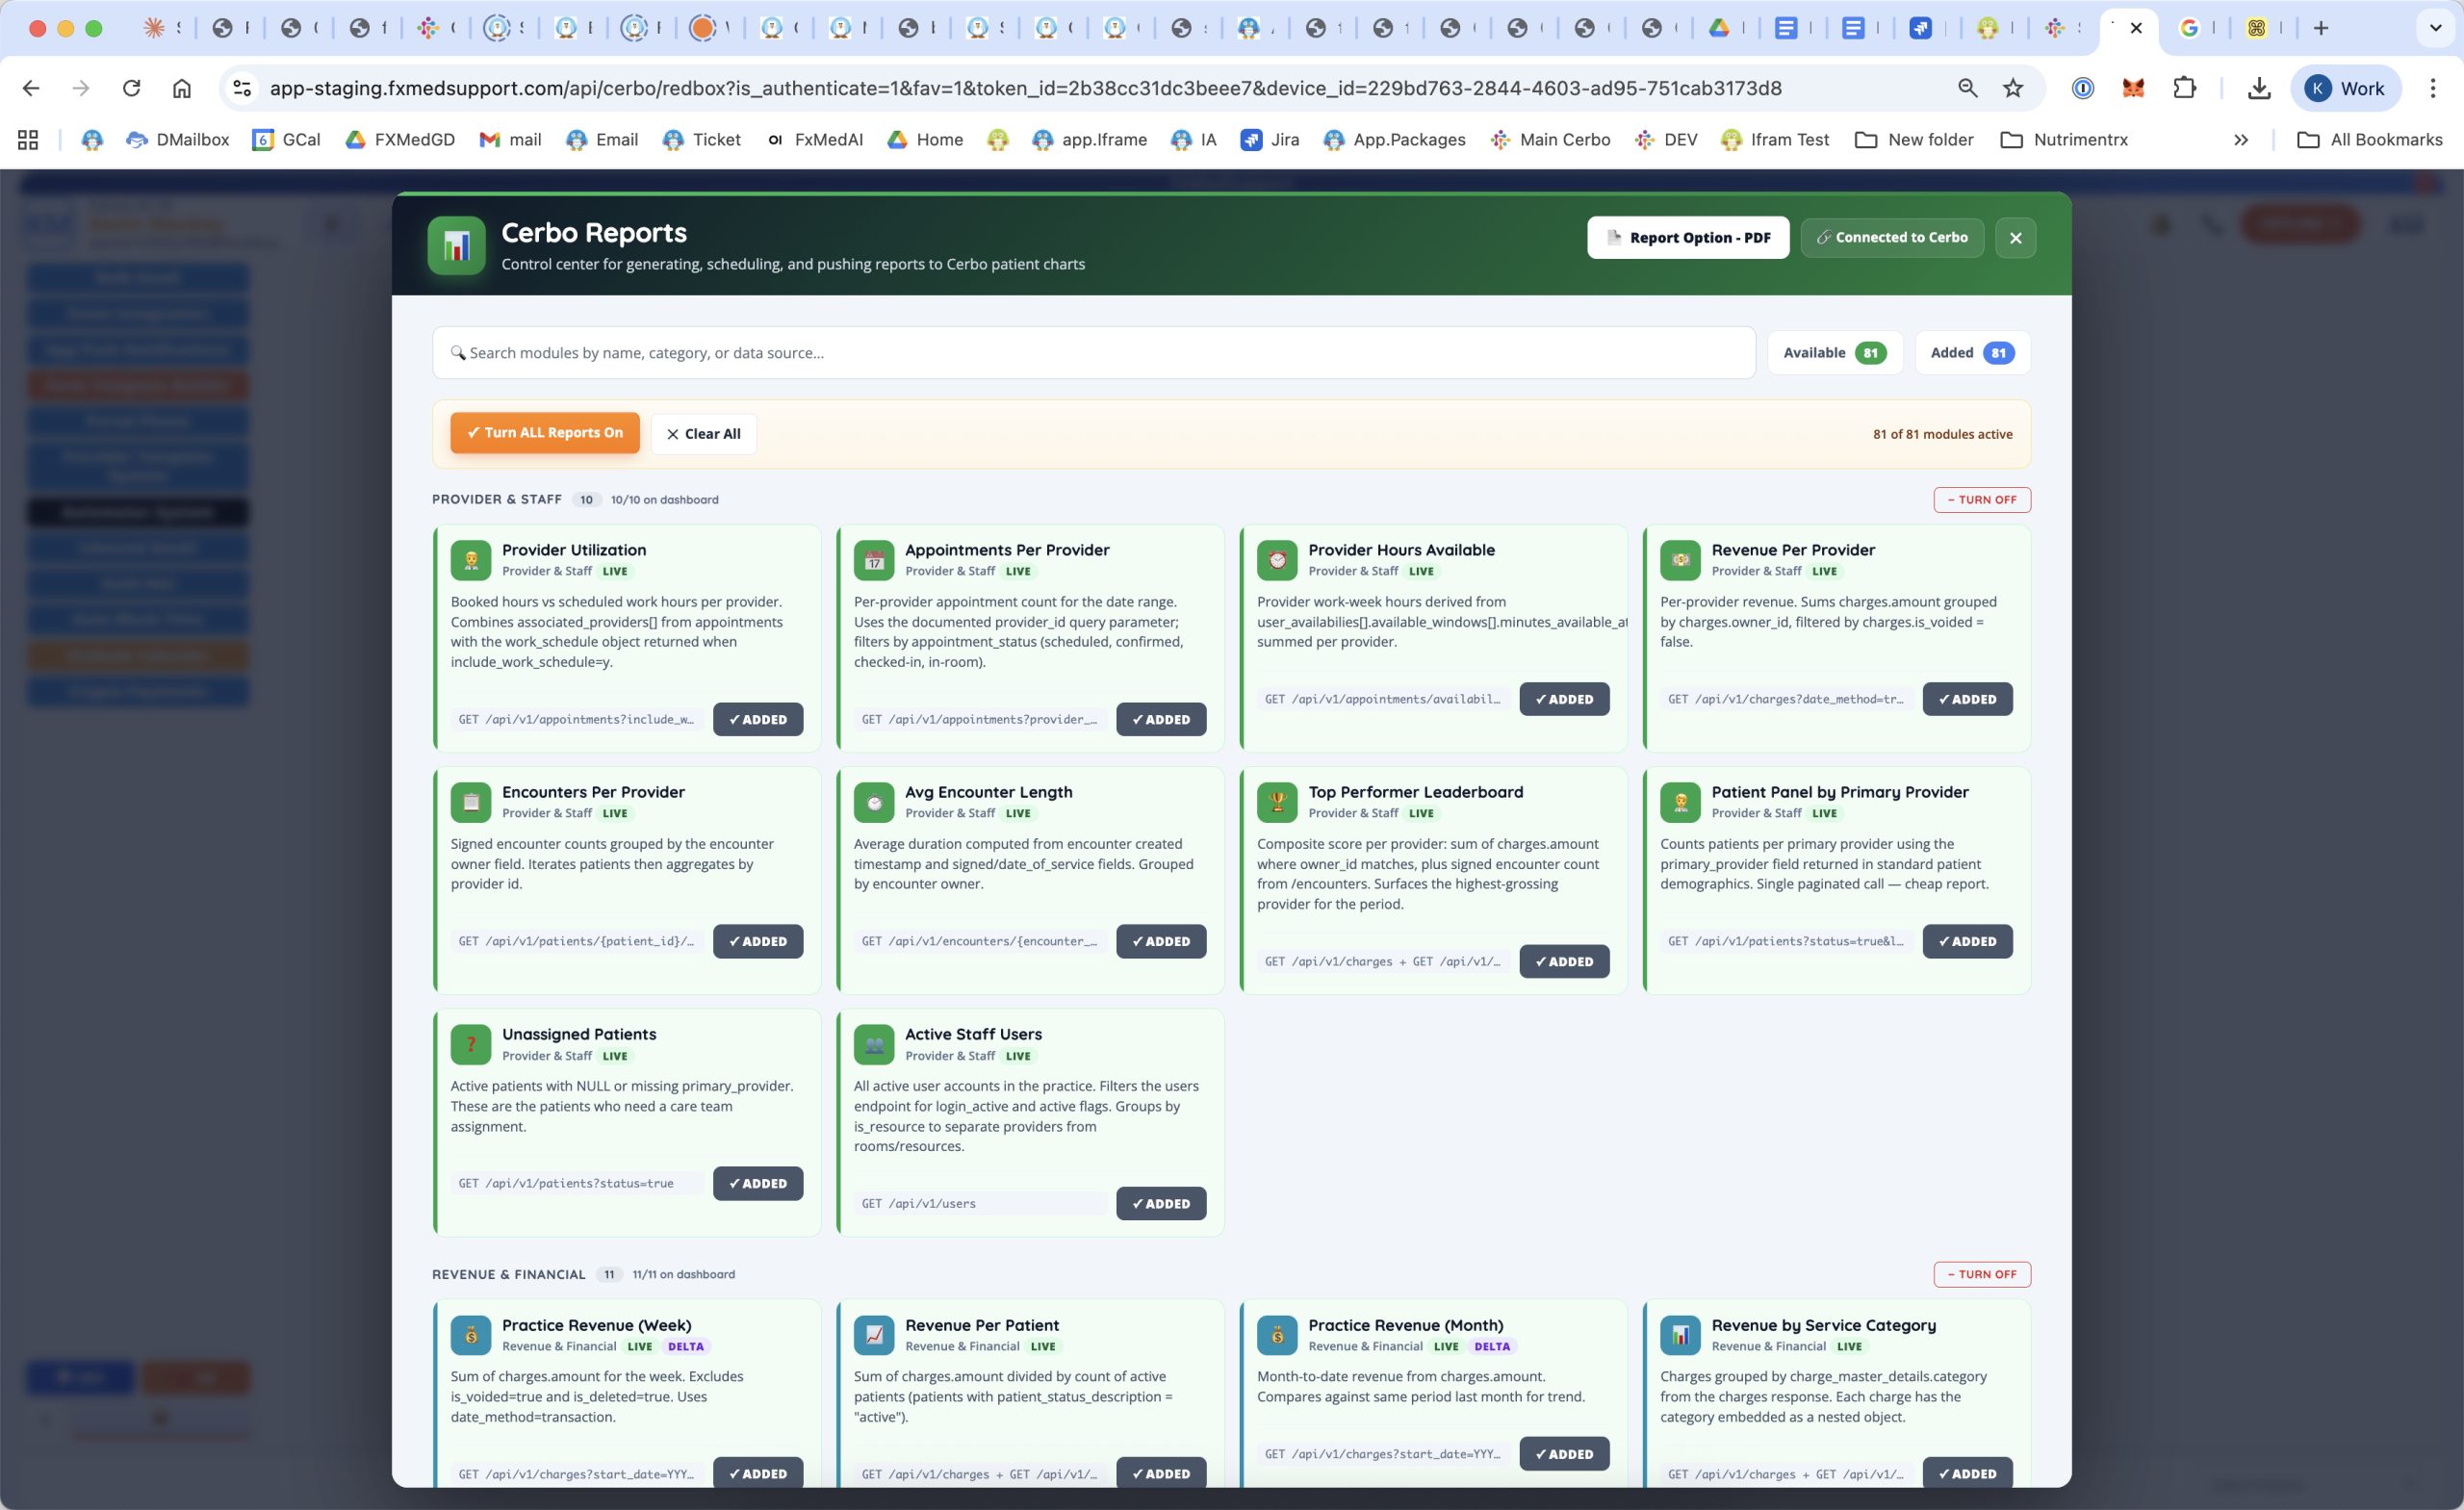
One panel. Total control.
The Reports control center sits inside FxMedSupport, directly connected to Cerbo. Browse the full catalog. Search by name, category, or data source. Activate the reports your team needs. Skip the ones you don’t.
Or — and this is what most practices do — turn on the entire library with a single click. Every metric. Every angle. Every category. Live, the moment you activate.
The right reports. The right people.
The same picture.
A unified dashboard is powerful. A unified team is unstoppable. The Portal Cerbo Visual Reporting System ships with built-in Auto Reporting Email — beautifully designed PDF reports delivered automatically, on the schedule you set, to exactly the people who need them. Every team member operating from the same data, every week, every cycle. That’s leadership.
Pick the reports
Choose any combination of reports — by category, by team, or by topic.
Title them
Give each scheduled email its own title — “Weekly Operations Report,” “Q3 Provider Performance,” etc.
Choose the recipients
Send to one person or a group. Practice manager, billing, ops lead, providers — whoever needs to see it.
Set the cadence
Daily, weekly, monthly, quarterly — or any custom schedule that fits how your practice runs.
Different teams. Different reports.
One shared reality.
When your practice manager, billing team, and ops lead all walk into Monday’s meeting already aligned on the same data — that’s when you stop having “what is everyone seeing?” conversations and start having “what should we do about it?” conversations.
Aligned teams. Aligned data.
That’s leadership.
Cerbo’s reporting engine has always been one of the strongest assets in functional medicine — accurate, comprehensive, every metric you could want, captured perfectly. The numbers have always been there. What’s been missing is the dimension — and the distribution.
We took the depth of Cerbo’s reporting and built a fully visual, interactive layer on top of it. Every metric. Every trend. Every pulse-check on practice health — in one beautifully designed view that brings the data to life. Then we made it shareable: pick the reports your team needs, choose who gets each one, set the cadence, and beautiful PDFs land in the right inboxes, automatically.
Most practices don’t have a data problem. They have an alignment problem. Your provider sees one slice. Your billing team sees another. Your ops lead is working from a third. Everyone is working hard. Everyone is working differently. Everyone is reacting to a partial picture.
When the same dashboard powers every conversation in your practice — when your Monday meeting starts with everyone already looking at the same revenue trend, the same utilization patterns, the same patient flow data — something fundamental shifts. You stop having “what’s actually happening?” conversations and start having “what should we do next?” conversations.
That’s not reporting. That’s leadership.
Cerbo holds the truth.
The Portal Cerbo Visual Reporting System aligns your team to it.
Stop guessing. Start leading.
The Portal Cerbo Visual Reporting System is live and ready. Activate it today — and start running every team meeting from a single, shared, undeniable picture of your practice.